
Do you know what is the difference between a chicken and an elephant? Of course, from the size it is very clear that the elephant has a size that is much different from the chicken, then can you distinguish a male chicken and a female chicken? If you look at the anatomy of a chicken, you will find several characteristics that state that a chicken is a male, for example, the presence of a cockscomb on a male chicken which has a large size compared to its female, but this will certainly be more difficult when you distinguish male and female chickens than comparing chickens and an elephant.
In life there are many things that cannot be compared easily because as a whole they are very similar and even difficult to distinguish, the approach using the Senses alone is not enough to determine that a variable has a difference.
In practice, it is easy for a geologist to describe a rock because rocks have distinguishing indicators that we can feel with our five senses, such as the most scale with our sense of taste, then color with our eyes, or even the smell that sometimes an element has its characteristics. But how do we describe something whose comparative parameters we cannot reach with our five senses?
One of the ways we can do this is by using a statistical approach. In simple terms, statistics will help us define something qualitative with a quantitative approach. In reserve estimation activities, statistical analysis is needed to determine the characteristics of the data distribution we have.
Descriptive statistics will help us to reveal whether the data that we have is a data with a distribution which varies high or low, in the practice of resource estimation we need domaining activities to minimize the possibility of bias from the estimates that we will do, why is that?
Imagine if you work in a company that supplies a door plate in a car, if you do not classify the car correctly, it is very likely that the supply you will give to the car manufacturing company will not be appropriate because cars sometimes have 2 doors or even 4 doors depending on the type of vehicle to be produced.
If you do not do the domaining activities correctly then there will be a bias in the resource estimate, because sometimes a mineral is formed by a different mineralization process than others.
In general, there are several descriptive statistics needed to identify the distribution of data, which are as follows:
Mean/average is the average of data, or it can be considered as the number that shows the concentration of data from the many data that we have
Mode is the value that appears most often in a group of data
Median is the middle value of a composed data set
Standard Deviation is a value that shows the spread of each data
Coefficient of correlation is a number that shows a variance of data distribution
Min is the smallest value of the data distribution
Max is the largest value of the data distribution
This statistical analysis is very helpful in providing a description that whether the data is a data with a single distribution or a compound distribution.
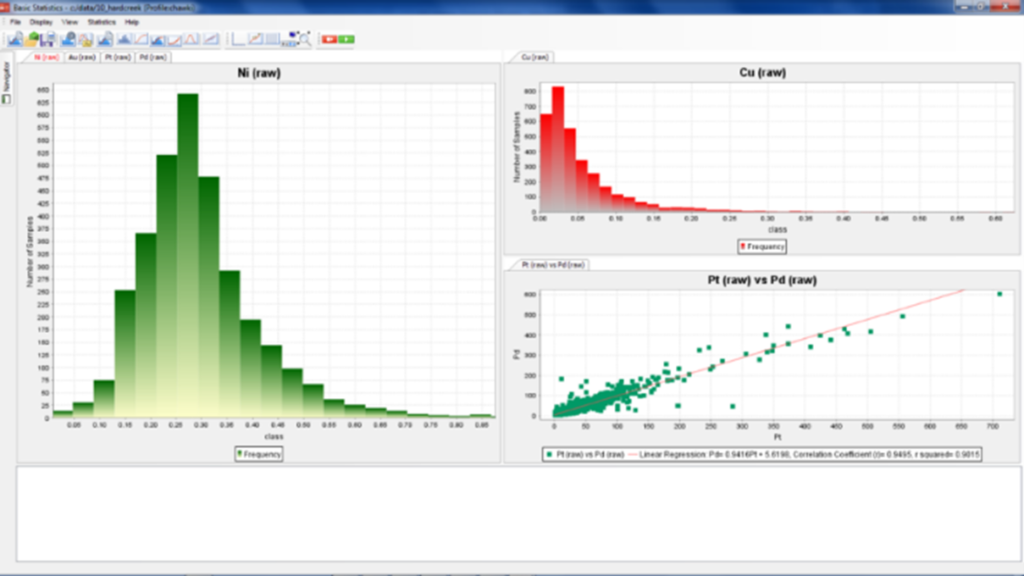
In the GEOVIA Surpac application, this statistical analysis has been covered in the Basic Statistical Analysis section, in GEOVIA Surpac this activity is covered in the form of numbers and also in the form of diagrams.
Here is an example of the diagram form that you will find in GEOVIA Surpac:
And here is an example of a report from statistical analysis in GEOVIA Surpac:

By using statistical analysis, you will be able to determine the treatment needed from the distribution of the data you have grouped, from there you can also analyse whether the grouping you have done is good or there are still special treatments you will do such as grade capping and others.
The use of statistical analysis is an activity that is carried out repeatedly until it produces the most optimal results so that it will increase the results of the “confidence” value in the data that you will estimate.
Statistical data analysis is a very crucial activity in resource estimation activities because this analysis will give us an overview of the spatial characteristics of the data we obtain, and with it the estimation methods used will increasingly show more accurate values compared to data that are not subject to statistical analysis.
As reported in the JORC Code 2012, a mineral deposit is a collection of solid material of economic interest in or on the Earth’s crust in any form, such as quality, quantity, or other economic aspects. Location, quantity, quality, continuity, and other geological characteristics are known by proving geological data and specific knowledge, including sampling.
Resource estimation requires geological determination and spatial analysis to obtain information about the mineral reserves to be mined.